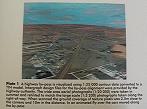
plate1.jpg
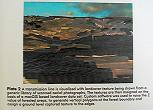
plate2.jpg
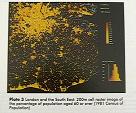
plate3.jpg
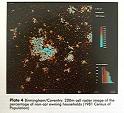
plate4.jpg
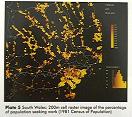
plate5.jpg
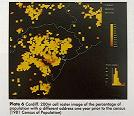
plate6.jpg
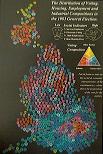
voting.jpg
Summary - "Introduction to Visualizing Data Validity"
M.Goodchild, B.Buttenfield & J. Wood
In "Visualization in Geographical Information Systems", edited
by Hilary M, Hearnshaw & David J. Unwin
The paper states that in order to approach issues and display of data validity, the priorities for the initiative include:
The types of validity that may be discovered or measured in geographical data most commonly include error and accuracy. Accuracy measures the discrepancy from modeled or an assumed value, while error measures the discrepancy from the true value. Because it is impossible to collect a complete dataset, therefore the value may be inferred. For this reason, many standards for data quality assessment include indices of accuracy rather than error. The paper gives an example of root mean square error (RMSE), which is in fact an accuracy measure of perpendicular distance using a model of geometry as reference.
Visualization let us visualize the validity of the data. It also acts as an effective communication medium, conveying the effects of error on modeling the real world.
However, visual representation of validity is controlled by a set of rules provided by statistics. Statistics provide a mathematical framework for describing and manipulating uncertainly. It provides a means of dealing systematically with incomplete information. Statistics also provide a means of handling uncertainly that is responsive to its form but independent of the process by which it was generated. But there are circumstances where errors sufficiently large or unique, and where the generalizations of statistics would have no relevance. The use of statistics also implies that uncertainty is quantifiable, whereas the validity of spatial data is often recorded qualitatively.
There are two modes if visualization can be applied to display the validity of GIS data. They are static mode of display and dynamic cartographic
Static mode of display is basically traditional cartographic displays, they provide static snapshots of data surfaces and objects, affording visualization at specific or selected phases of data processing.
Dynamic cartography is also known as map animation. Dynamic displays provide advantage to viewers and designer of GIS displays, particularly in the context of validity and metadata. The other advantage is that for position accuracy (symbol movement overcomes the problem of viewers attaching too much weight to particular cartographic representations).
Research issues that remain to be addressed include:Sample images
 plate1.jpg |
 plate2.jpg |
 plate3.jpg |
 plate4.jpg |
 plate5.jpg |
 plate6.jpg |
 voting.jpg |