|
||||||
|
Remote Sensing, Aerial Photography
(adapted from http://www.utexas.edu/depts/grg/gcraft/notes/remote/remote.html)
Introduction
- This unit introduces basic concepts of remote sensing of the
environment.It is intended to provide you with the background information
necessaryto successfully use remotely sensed imagery in conjunction with GIS
technology to answer questions about the world in which we live.
In recent years, technological advances have changed the way geographicanalyses are done. Increasingly, computers are used to automate aspectsof cartography and remote sensing, producing data that are easily integrated into a GIS.
Many GIS systems have the capability of incorporating aerial photography,satellite data, and radar imagery into their data layers. The process issimple, as images may be scanned or read off a data tape. However, to usethis technology effectively, it is important to know the strengths andlimitations of remotely sensed data, and to understand which types of imageryare suited to particular projects. This unit was developed with these concernsin mind. The information and exercises contained within it are intendedto familiarize you with the interface between remote sensing and GIS.
 Foundations of
RemoteSensing
Foundations of
RemoteSensing
 TheElectromagnetic
Spectrum
TheElectromagnetic
Spectrum
The USGS defines the electromagnetic spectrum in the following manner:"Electromagnetic radiation is energy propagated through space between electricand magnetic fields. The electromagnetic spectrum is the extent of thatenergy ranging from cosmic rays, gamma rays, X-rays to ultraviolet, visible,and infrared radiation including microwave energy."
Electromagnetic Waves
Electromagnetic waves may be classified by FREQUENCYor WAVELENGTH, and the velocity of ALL electromagneticwaves is equal to the speed of light, which we (along with Einstein) will refer to as c.
 Wavelengthand Frequency of common EM waves
Electromagnetic waves are radiated through space. Whenthe energy encounters an object, even a very tiny one like a molecule ofair, one of three reactions occurs. The radiation will either be reflectedoff the object, absorbed by the object, of transmitted through the object.The total amount of radiation that strikes an object is referred to as the incident radiation, and is equal to:
reflected radiation + absorbed radiation + transmitted radiation
In remote sensing, we are largely concerned with REFLECTED RADIATION.This is the radiation that causes our eyes to see colors, causes infraredfilm to record vegetation, and allows radar images of the earth to be created.
The electric field and the magnetic field are important concepts thatcan be used to mathematically describe the physical effects of electromagneticwaves.
The electric field vibrates in a direction transverse (i.e. perpendicular) to the direction of travel of the electromagnetic wave.
The magnetic field vibrates in a direction transverse to the directionof the em wave AND transverse to the electric field.
POLARIZATION: Polarization is defined by the orientation of theelectrical field E. It is usually described in terms of HORIZONTAL POLARIZATIONand VERTICAL POLARIZATION. Polarization is most important when discussingRADAR applications of remote sensing.
 Aerial
Photography
Aerial
Photography
- Introduction
- objects are portrayedfrom an overhead (and unfamiliar) position.
- very often, infrared wavelengths are recorded, and
- photos are taken at scales most people are unaccustomed to seeing
- Tone (also called Hue or Color) -- Tone refers to the relative brightnessor color of elements on a photograph. It is, perhaps, the most basic ofthe interpretive elements because without tonal differences none of theother elements could be discerned.
- Size -- The size of objects must be considered in the context ofthe scale of a photograph. The scale will help you determine if an objectis a stock pond or Lake Minnetonka.
- Shape -- refers to the general outline of objects. Regular
geometricshapes are usually indicators of human presence and use. Some
objects canbe identified almost solely on the basis of their shapes.
- the Pentagon Building
- (American) football fields
- cloverleaf highway interchanges
- Texture -- The impression of "smoothness" or "roughness" of imagefeatures is caused by the frequency of change of tone in photographs. Itis produced by a set of features too small to identify individually. Grass,cement, and water generally appear "smooth", while a forest canopy mayappear "rough".
- Pattern (spatial arrangement) -- The patterns formed by objectsin a photo can be diagnostic. Consider the difference between (1) the randompattern formed by an unmanaged area of trees and (2) the evenly spacedrows formed by an orchard.
- Shadow -- Shadows aid interpreters in determining the height ofobjects in aerial photographs. However, they also obscure objects lyingwithin them.
- Site -- refers to topographic or geographic location. This characteristicof photographs is especially important in identifying vegetation typesand landforms. For example, large circular depressions in the ground arereadily identified as sinkholes in central Florida, where the bedrock consists of limestone. This identification would make little sense, however, ifthe site were underlain by granite.
- Association -- Some objects are always found in association
withother objects. The context of an object can provide insight into
whatit is. For instance, a nuclear power plant is not (generally) going tobe
found in the midst of single-family housing.
Advantages of Aerial Photography over Ground-BasedObservation
- Aerial photography offers an improved vantage point.
- Aerial photography has the capability to stop action.
- It provides a permanent recording.
- It has broader spectral sensitivity than the human eye.
- It has better spatial resolution and geometric fidelity than many ground-basedsensing methods.
Aerial photography has two uses that are of interest within thecontext of this course: (1) Cartographers and planners take detailed measurementsfrom aerial photos in the preparation of maps. (2) Trained interpretersutilize arial photos to determine land-use and environmental conditions,among other things.
Although both maps and aerial photos present a "bird's-eye" viewof the earth, aerial photographs are NOT maps. Maps are orthogonal representationsof the earth's surface, meaning that they are directionally and geometricallyaccurate (at least within the limitations imposed by projecting a 3-dimensionalobject onto 2 dimensions). Aerial photos, on the other hand, display ahigh degree of radial distortion. That is, the topography is distorted, and until corrections are made for the distortion, measurements made froma photograph are not accurate. Nevertheless, aerial photographs are a powerfultool for studying the earth's environment.
Because most GISs can correct for radial distortion, aerial photographsare an excellent data source for many types of projects, especially thosethat require spatial data from the same location at periodic intervalsover a length of time. Typical applications include land-use surveys andhabitat analysis.
This unit discusses benefits of aerial photography, applications,the different types of photography, and the integration of aerial photographsinto GISs.
Basic Elements of Air Photo Interpretation
Novice photo interpreters often encounter difficulties when presentedwith their first aerial photograph. Aerial photographs are different from"regular" photos in at least three important ways:
- Black and White
![]() Austin,
Texas
Austin,
Texas
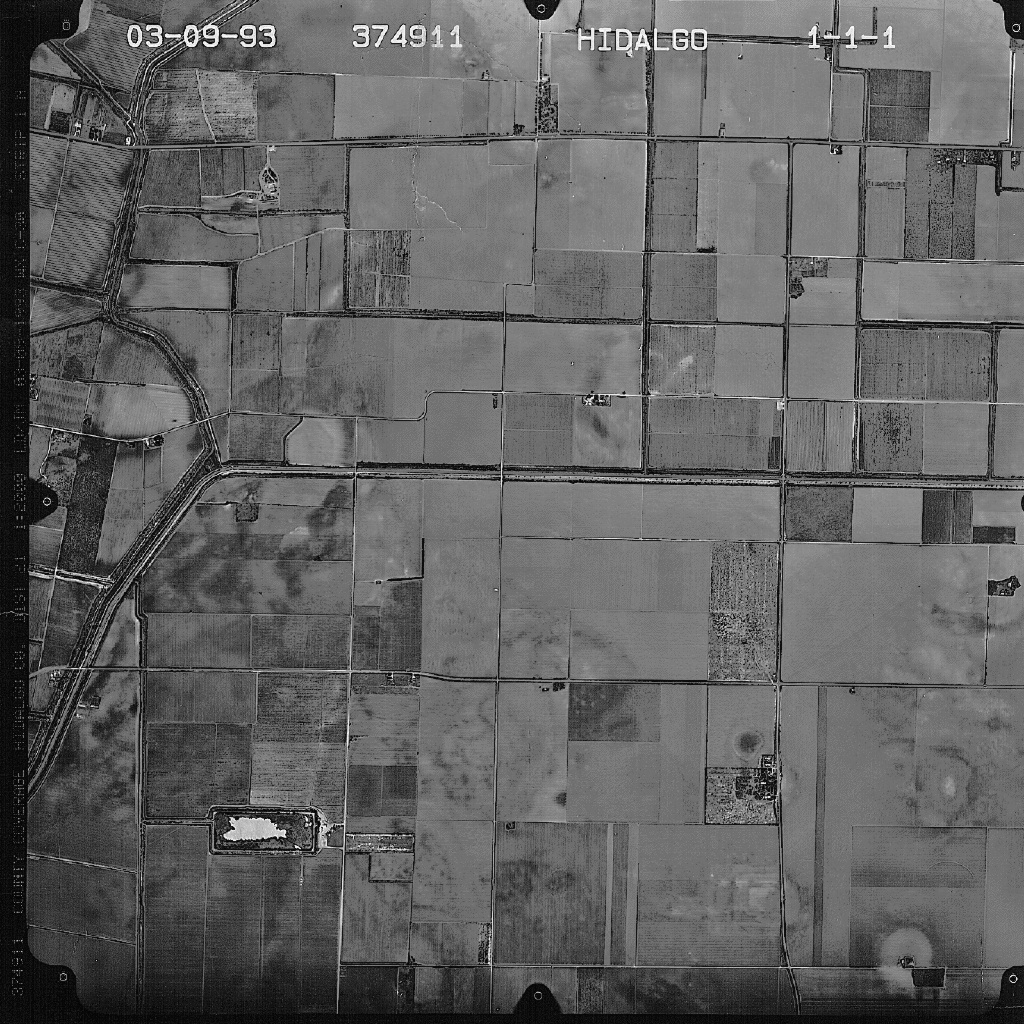 HidalgoCounty,
Texas
HidalgoCounty,
Texas
Color
Color Infrared
In 1903 or 1904 the first reliable black and white infrared filmwas developed in Germany. The film emulsion was adjusted slightly fromregular film to be sensitive to wavelengths of energy just slightly longer than red light and just beyond the range of the human eye. By the 1930s,black and white IR films were being used for landform studies, and from1930 to 1932 the National Geographic Society sponsored a series of IR photographs taken from hot air balloons.
Throughout the 1930s and 1940s, the military was hard at work developing color infrared film, eager to exploit it for surveillance. Bythe early 1940s the military was successful in its attempts. It developeda film that was able to distinguish camouflaged equipment from surrounding vegetation. Within months, however, an IR reflecting paint was developedfor use on military vehicles, effectively making IR film technology uselessto the military. So, they dropped it.
The scientific community, however, has made continuous use of the filmtechnology.
Color infrared film is often called "false-color" film. Objectsthat are normally red appear green, green objects (except vegetation) appearblue, and "infrared" objects, which normally are not seen at all, appearred.
The primary use of color infrared photography is vegetation studies.This is because healthy green vegetation is a very strong reflector ofinfrared radiation and appears bright red on color infrared photographs.
more to come
Applications of Aerial Photography
- Introduction: The Scope of Air Photography
Land-Use Planning and Mapping
Geologic Mapping
Archaeology
Species Habitat Mapping
 Digital Image
Processing
Digital Image
Processing
Why Process Remotely Sensed Data Digitally?
Humans are adept at visually interpreting data. We can distinguishmillions of colors, several shades of gray, and have a demonstrated abilityto identify water, vegetation, and urban forms on several types of imagery.Why try to expand on this?
- (1) There are limits to a person's ability to distinguish small differencesin color. We are especially limited in our resolution of shades of gray. If data are collected using 256 shades of gray, but an analyst can onlydistinguish 8-10 (optimistically) of them, a great deal of informationis potentially lost. The human interpreter is outpaced by the precisionof the data. Computers, however, have no trouble distinguishing 256 shadesof gray. Each one is individually recognizable. And, the analyst has controlover the conputer's presentation of the data. She can group it any wayshe pleases, extract a portion of it, or display it in false color. Datasets can also be combined, compared, and contrasted with more ease andprecision (not to mention speed) than if the task were left to humans alone.
- (2) Human interpretations are highly subjective, hence, not perfectly repeatable.Conversely, results generated by computer--even when erroneous--are usuallyrepeatable.
- (3) When very large amounts of data are involved (a series of photos ofan orange grove taken at 5 day intervals over an entire growing season)the computer may be better suited to managing the large body of detailed(and tedious) data.
Satellite
Imaging
Introduction
LANDSAT refers to a series of satellites put into orbit around the earth to collectenvironmental data about the earth's surface. The LANDSAT program was initiatedby the U.S. Department of Interior and NASA under the name ERTS, an acronymwhich stands for Earth Resources Technology Satellites. ERTS-1 was launchedon July 23, 1972, and was the first unmanned satellite designed solelyto acquire earth resources data on a systematic, repetitive, multispectralbasis. Just before the launch of the second ERTS satellite, NASA announcedit was changing the program designation to LANDSAT, and that the data acquiredthrough the LANDSAT program would be complemented by the planned SEASAT oceanographic observation satellite program. ERTS-1 was retroactively namedLANDSAT-1, and all subsequent satellites in the program have carried the LANDSAT designation. Over time, the sensors carried by the LANDSAT satelliteshave varied as technologies improved and certain types of data proved more useful than others. The table which follows outlines the sensors onboardeach satellite, their launch dates, and the dates they were decommissioned.
![]() Table 1
Table 1
The various Landsats have had Multispectral Scanners (MSS)  ,Return Beam Vidicon (RBV) scanners, and Thematic
Mapper (TM)
,Return Beam Vidicon (RBV) scanners, and Thematic
Mapper (TM) ![]() scanners. Each
type has its own spectral range and spatial resolution.
scanners. Each
type has its own spectral range and spatial resolution.
Interpreting Landsat Data
The images discussed in this section are the property of the Universityof California, Santa Barbara. Click here to get to the Center for Ecological Health Research Home Page, then clickon the image indicated below, then back up to this page with the imagestill visible to read the discussion that pertains to the image. Detailedexplanations of the images will be added soon.
- Click on the first image, labeled "California". This is a false color imagethat has been processed by computer.
- Now, close the image of California and return to the CEHR Home Page. Clickon the third image, labeled "San Francisco Bay Delta, Northern California".more to come
NOAA Geostationaryand Polar Orbiting Satellites
![]() NOAAGOES mission
overview and history. The GOES graphic was prepared by theNASA Goddard Space
Flight Center, which maintains a page on the next generationof GOES satellites
here.
NOAAGOES mission
overview and history. The GOES graphic was prepared by theNASA Goddard Space
Flight Center, which maintains a page on the next generationof GOES satellites
here.
![]() The firstvisible
GOES-8 image. Look carefully and you can make out Baja Californiaon the lower
left and Lake Michigan on the upper right.
The firstvisible
GOES-8 image. Look carefully and you can make out Baja Californiaon the lower
left and Lake Michigan on the upper right.
Applications of Satellite Imagery
Integration of Satellite Imagery into GIS
Further Reading
Bauer, M.E., T.E. Burk, A.R. Ek, P.R. Coppin, S.D. Lime, T.A.Walsh, D.K. Walters, W. Befort, and D.F. Heinzen. SatelliteInventory of Minnesota Forest Resources. Photogrammetric Engineeringand Remote Sensing, in press.
 MSS, Thermal, and
HyperspectralScanning
MSS, Thermal, and
HyperspectralScanning
Thermal Radiation
Principles
Thermalinfrared radiation refers to electromagnetic waves with a wavelengthof between 3.5 and 20 micrometers. Most remote sensing applications makeuse of the 8 to 13 micrometer range. The main difference between THERMALinfrared and the infrared discussed above is that thermal infrared is emittedenergy, whereas the near infrared (photographic infrared) is reflected energy.
Interpreting Thermal Scanning Imagery
Limitations of Thermal Infrared Imaging
There are some limitations of thermal imagery you should be awareof if you plan to use it in your GIS:
- It is very expensive.
- Most thermal imaging systems have very strict operational parameters. Forexample, the detector must be kept extremely cold during use.
- Thermal infrared imaging systems are notoriously difficult to calibrate.
- The data collected has extensive processing requirements. A PC isn't goingto cut it.
- Thermal images can be quite difficult to interpret when compared with othertypes of imagery.
- Thermal imagery is NOT geometrically correct.
- Thermal images of water measure only the very top layer of the water. Theytell you nothing of the water's characteristics below the top few micrometers.
Radar (Microwave) Scanning
Introduction:Radar Images
The following radar images come from sites all over the world. The filesat NASA's Jet Propulsion Laboratory have explanations accompanying theimages.
![]() SpaceborneSynthetic
Aperture Radar, Oetxal, Austria. This file was created byNASA's Jet Propulsion
Laboratory in Pasadena, CA.
SpaceborneSynthetic
Aperture Radar, Oetxal, Austria. This file was created byNASA's Jet Propulsion
Laboratory in Pasadena, CA.
Remote Sensing and GIS
To sum up, remotely sensed images have a number of features which makethem ideal GIS data sources.- Remote sensing provides a regional view.
- Remote sensing provides repetitive looks at the same area.
- Remote sensors "see" over a broader portion of the spectrum than the
humaneye.
- Sensors can focus in on a very specific bandwidth in an image.
- They can also look at a number of bandwidths simultaneously.
- Remote sensors often record signals electronically and provide
geo-referenced,digital, data.
- Some remote sensors operate in all seasons, at night, and in bad weather.