|
||||||
|
Histograms
and Their Meanings
Historgram is a kind of metric you can calculate that tells you information about the pixels in the image. A histogram tells you the number of pixels that have any particular value. So, in a sense it measures the frequency of a particular pixel value.
In the case of greyscale images, you calculate the number of pixels that have each possible grey value starting and 0 and ending at 255. You can also calculate the histograms for color images. Many times for color images, three histograms will be generated, one for red, one for green and one for blue.
h(x) = number of pixels ("frequency in chart below") that have the value x.
Algorithm to calculatefor (each pixel p in the image ) |
Pseudo Code to calculate Histogram L=#quatization levels (256 if greyscale)
for (j=0 to L)
h(j) = 0;
for (r=1 to RowSize)
for(c=1 to ColumnSize)
{ greyvalue = f(r,c);
h(greyvalue) = h(greyvalue) + 1;
}
For example, suppose we have the following greyscale image: 
Using the previous algorithm, initially,
|
SOME options with color images, convert to greyscale and then create the histogram OR
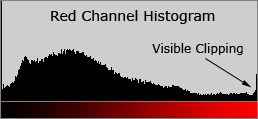
as shown below calculate 3 histograms, one for each color field.
 |
 Intensity Historgram Intensity Historgram |
RED Channel |
Red Channel Histogram |
Meaning of Histograms
| Dark Image Histogram | Bright Image Histogram |
 |
 |
| Low Contrast Histogram | High Contrast Histogram |
 |
Various Images and their histograms (greyscale)
 |
 |
 |
 |


