|
||||||
|
Image Information
(adapted in part from http://venus.javeriana.edu.co/course/course-index.html)One of the first steps in performing any type of data processing is to get information about the data file under observation. In order to continue data processing tasks, it is helpful to know some basic information and statistics on the data file. Some valid questions to ask of the data file are:
- dimensions (width, height, depth, time, elements)
- data type of pixel elements
- machine architecture (Big Endian vs Little Endian)
- file storage format (viff, tiff, gif, etc)
- color table
- color space model (RGB, CMY, HSI, etc)
- validity mask
- mean value, variance, standard deviation, etc.
- maximum and minimum values and their location
- distribution of values, histogram
The image for our experiment is shown below.
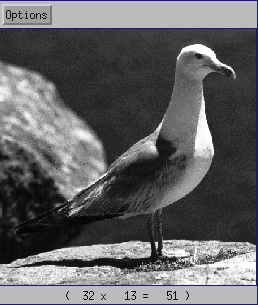
Original image
Here is a list of attributes of the image under observation.
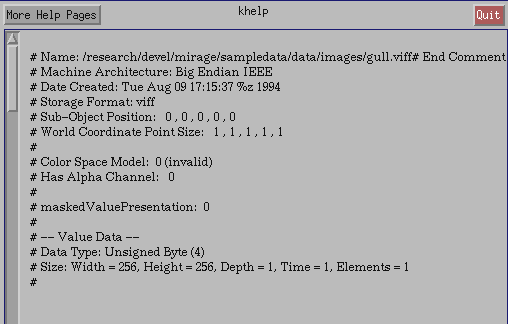
Image file information
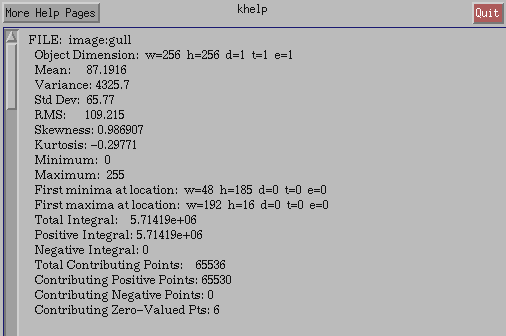
Image file statistics
In addition to these questions, the user may want to work only on a specific region of interest (ROI) of size 10 x 10 around the eye of the seagull in the original image. As 10 x 10 is very small, the user can zoom the region.

Extracted 10x10 region around the seagull's eye in the original image

Same image, but zoomed
The user can also print those values of the 10 x 10 ROI image:
142 174 164 218 250 255 250 252 255 255

107 107 102  80 127 174 237 218 252 255

 90  34  24  34  34  24  51  88 127 164

 80  26  19  53  34  19  24  85 117 137

 78  76  34  44  26  26  34  24  71  90

 85  85  90  26  26  26  26  34  76  83

 88 102  90  53  26  26  34  73  85  78

102 110 105  90  98 105 105 110 107  93

107 115 110 110 110 117 115 110 107 102

105 110 110 117 110 132 115 110 107 105
The user can see this small image as a surface, where the pixel intensity values represents the height of the points. The visualization of this surface can be seen below
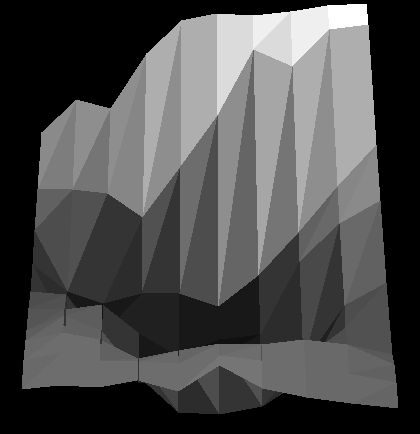
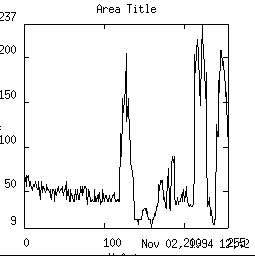
The user can plot the intensity profile of the central vertical line of the original image:
 ..
..
The histogram provides the distribution of the grey levels in an image.

From the histogram we can infer that there is a large number of pixels concentrated in the dark area. These pixels are probably from the sea background.
.
