|
CS6320: SW Engineering of Web Based Systems |
||||||
|
GAE Budget, Pricing and Tuning for it
-
GAE Pricing Model -- like Amazon you now pay per instance (even if idle)
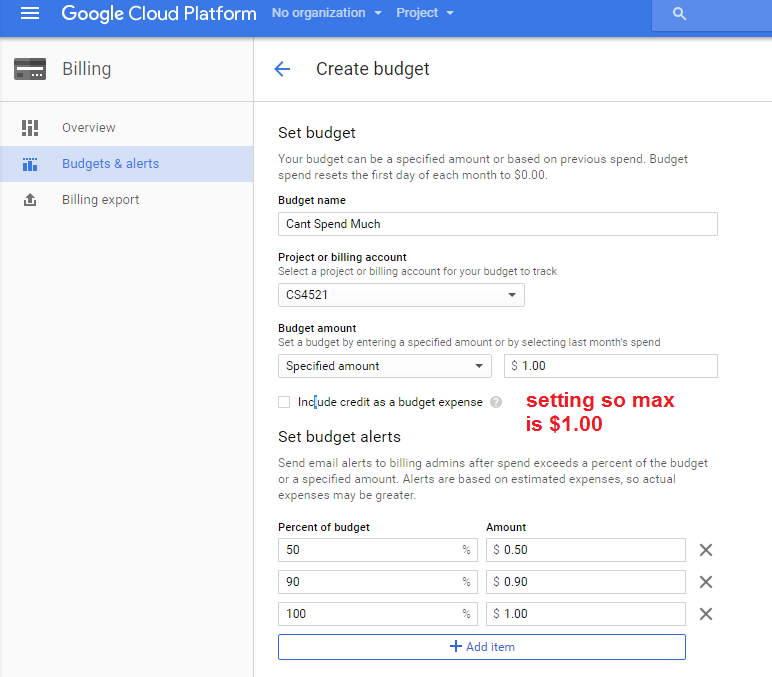
You can SETUP budgets in google console
Articles
- http://highscalability.com/blog/2011/9/7/what-google-app-engine-price-changes-say-about-the-future-of.html
- Analysis of a Program
- Results of Price Tuning (see bottom for repetition of some)
Tuning for Pricing
- This is really important --- but, something that is very different for each application that you might deploy (and there is a limit to what you can do or cant.....and the more you do, the more likely it is that it will be highly tuned for GAE only)
- = number of idle instances in anticipation of future work, set to controllable number (but large enough for scalability that is affordable)
- example: limit to 1 to 2 to reduce costs over running at around 10
- making this too small can cause GAE infrastructure to create more instances
- again you wait longer in exchange for budget
- example calls
- fetch(10,0) -- reads from 0 to 9
- fetch(10,X) - reads from 0 to X offset, then reads next 10 to return them
- and so on
- The datastore fetches offset + limit results to the application. The first offset results are not skipped by the datastore itself.
- The fetch() method skips the first offset results, then returns the rest (limit results).
- The query has performance characteristics that correspond linearly with the offset amount plus the limit.
- The number of results to return. Fewer than limit results may be returned if not enough results are available that meet the criteria.
- The number of results to skip.
- A configuration object for the API call.
- control the rate at which tasks are processed in each queue by defining rate, bucket_size, and max_concurrent_requests.
- uses token buckets to control the rate of task execution. Each named queue has a token bucket that holds a certain number of tokens, defined by the bucket_size directive. Each time your application executes a task, it uses a token. Your app continues processing tasks in the queue until the queue’s bucket runs out of tokens. App Engine refills the bucket with new tokens continuously based on the rate that you specified for the queue.
Some suggestions
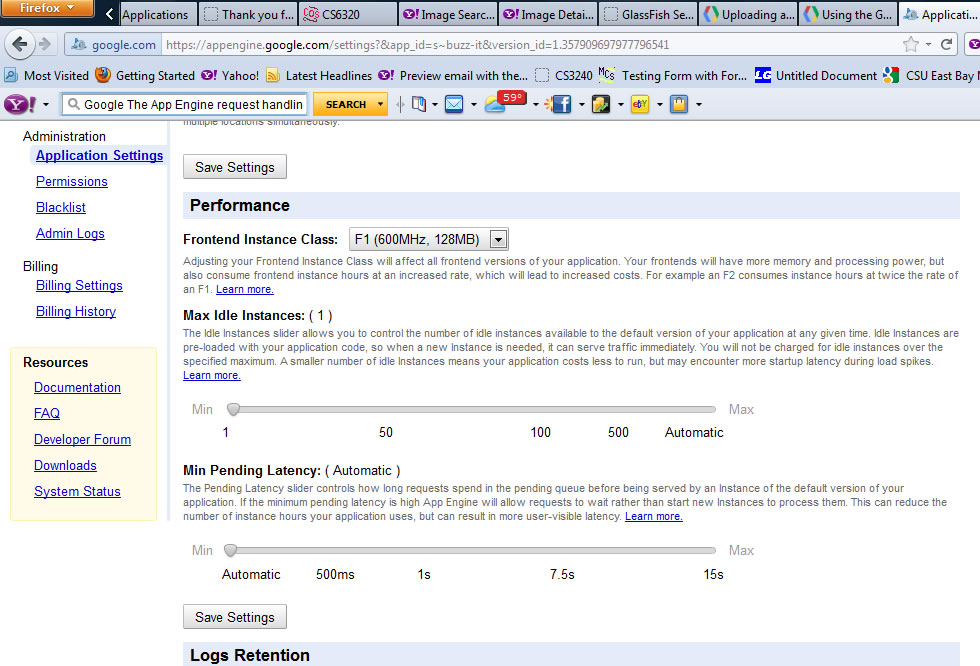
ADMIN SETTING: limit instances allowed with setting “Maximum Idle Instances”
ADMIN SETTING: limit Minimum Pending Latency
CODE ALTERATION: alter your code so it reduces:
--backend processing
--web requests
--polling
--continuous loops
only do the functionality that is necessary.
Example from article
But what’s worse, is that once every 2 mins, Syyncc says to AppEngine “Here, quick, do these 50 things RIGHT NOW”. AppEngine’s default rules are all around being a webserver, so it’s saying, crucially, if any tasks have to wait too long (ie: their pending latency gets too high), then kick off another instance to help service them. How long is the “automatic” minimum pending latency? I don’t know, but it can’t be much more than a second or two, going on the latency settings in my instances data.
So AppEngine kicks off an new instance, then another, but there are still heaps of tasks waiting, waiting! Oh no! Kick off more! And I’m guessing for syync it hits the 10 to 15 instances mark before it gets through all those tasks. Phew!
CODE ALTERATION: reduce data store reads
>>monitor with GAE andmin console what is going on
>>remove datastore entries for application not using
>>only access datastore when absolutely need it (is it important to get the latest item or will a "stale" version suffice)
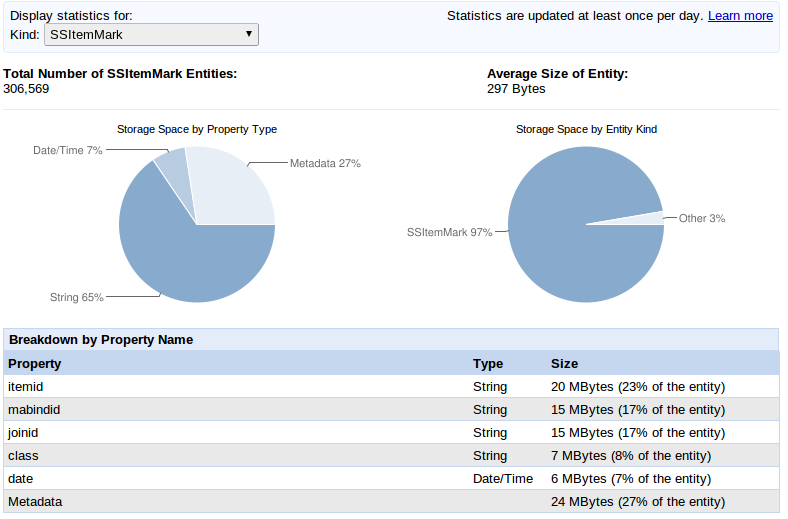
You can see your datastore statisics by clicking in admin module the Datastore Statistics
For this example application (see article) you see that the data store entity "SSItemMark" takes up 97% of the datastore size
and there are 306,569 of them (this can get $$$costly)
Solution: delete some of the trash, unused datastore entries of kind SSItemMark the program did not get rid of
CODE ALTERATION: be careful with datastore reads/writes....
<<example how do you use fetch(*) can make a difference
Example excessive fetch(*) calls and how fetch with offset does reads until gets to offset --$$$$
Code here runs through a while loop and each time calls a fetch of 10 items, getting the next 10 and so on updating fetch's offset to start at the next 10.
Some example code from article: (if you don't know language---read like pseudo code)
    def SetAllNextChecks(cls):
          monitor_query = SSMonitorBase.all().filter("enabled", True)
            offset = 0
          monitors = monitor_query.fetch(10, offset)
          while monitors and (len(monitors) > 0):
              for monitor in monitors:
                  if not monitor.nextcheck:
                      monitor.nextcheck = datetime.today() - timedelta(days=5)
                      monitor.put()
              offset += len(monitors)
              monitors = monitor_query.fetch(10, offset)
      SetAllNextChecks = classmethod(SetAllNextChecks)
fetch(limit, offset=0) Executes the query, then returns the results. The limit and offset arguments control how many results are fetched from the datastore, and how many are returned by the fetch() method:
Arguments:
limit
limit is a required argument. To get every result from a query when the number of results is unknown, use the Query object as an iterable instead of using the fetch() method.
offset
config
The return value is a list of model instances or keys, possibly an empty list.
So, paging through records using limit and offset is incredibly prone to blowing out the number of datastore reads; the offset doesn’t mean you start somewhere in the list, it means you skip (ie: visit and ignore) every object before reaching the offset. It’s easy to see how this could lead to the 60,000,000 data store reads/day $$$$$
CODE ALTERATION/XML SPECIFICATIONS FOR QUEUE runtime parameters Example
See http://point7.wordpress.com/2011/09/07/appengine-tuning-an-instance-of-success/
REDUCING PARAMETERS of bucket_size and rate for queues
there are application parameter settings defined in the xml file that can help to reduce costs
For python:
queue:
  - name: default
    rate: 0.5/s
    bucket_size: 1
For java (see api)
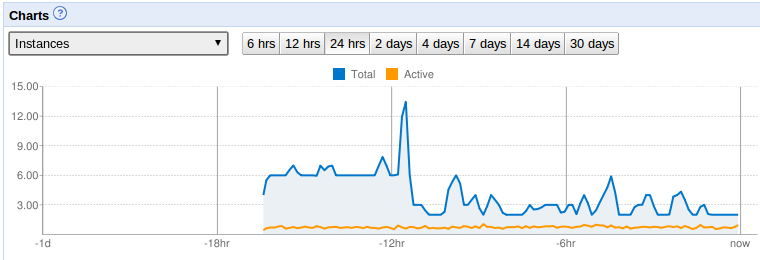
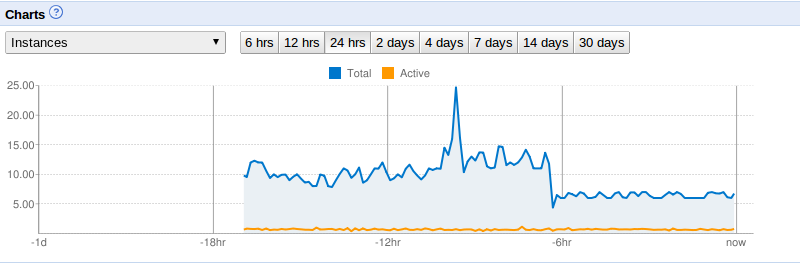
Results for this case study whe after -12hr when change made.
Case study Results from article
ADMIN SETTING: “Maximum Idle Instances = 1 AND Minimum Pending Latency = 15s |
Reported no change in use of App (???how tell ???polled user or looked at latency times or???)
Significantly reduced NUMBER OF INSTANCES which means LESS COST TO RUN THE APP !!!! (see drop at -6hr mark when made the changes) |
ADMIN SETTING: limit Minimum Pending Latency
|
|
CODE ALTERATION: alter your code so it reduces: --backend processing --web requests --polling --continuous loops
only do the functionality that is necessary. |
Example from article
|
CODE ALTERATION: reduce data store reads
>>monitor with GAE andmin console what is going on
>>remove datastore entries for application not using >>only access datastore when absolutely need it (is it important to get the latest item or will a "stale" version suffice) |
You can see your datastore statisics by clicking in admin module the Datastore Statistics
For this example application (see article) you see that the data store entity "SSItemMark" takes up 97% of the datastore size and there are 306,569 of them (this can get $$$costly)
Solution: delete some of the trash, unused datastore entries of kind SSItemMark the program did not get rid of |
CODE ALTERATION: be careful with datastore reads/writes.... <<example how do you use fetch(*) can make a difference |
Example excessive fetch(*) calls and how fetch with offset does reads until gets to offset --$$$$
Code here runs through a while loop and each time calls a fetch of 10 items, getting the next 10 and so on updating fetch's offset to start at the next 10.
Some example code from article: (if you don't know language---read like pseudo code)
fetch(limit, offset=0) Executes the query, then returns the results. The limit and offset arguments control how many results are fetched from the datastore, and how many are returned by the fetch() method:
Arguments: limit
limit is a required argument. To get every result from a query when the number of results is unknown, use the Query object as an iterable instead of using the fetch() method. offset
config
The return value is a list of model instances or keys, possibly an empty list. So, paging through records using limit and offset is incredibly prone to blowing out the number of datastore reads; the offset doesn’t mean you start somewhere in the list, it means you skip (ie: visit and ignore) every object before reaching the offset. It’s easy to see how this could lead to the 60,000,000 data store reads/day $$$$$ |
